Fortify 15.0 shows where your models stand
Key takeaways
- Fortify 15.0 applies the GAS Benchmark methodology directly to your AI system, not just the industry average.
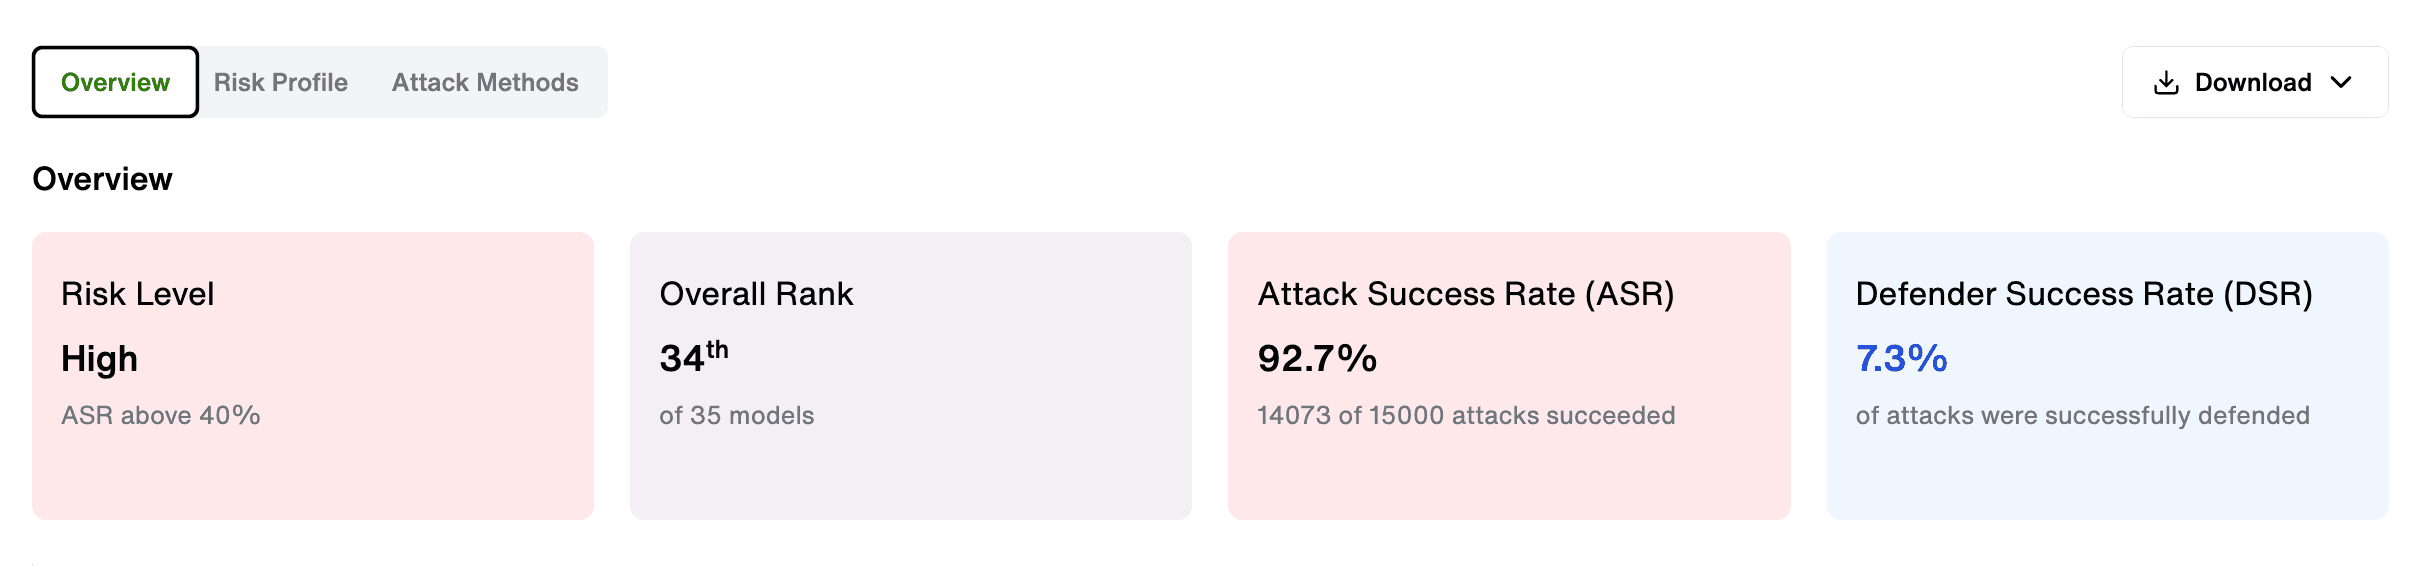
- You get five board-ready metrics: Risk Level, Overall Rank, Attack Success Rate, Defender Success Rate and Attack Category Highlights.
- The same attack set and judge used across 34 models and 10 providers now runs against your chatbot.
- Results are objective, reproducible and comparable to a published external standard.
- Security teams no longer have to interpret industry data and guess how it maps to their environment.
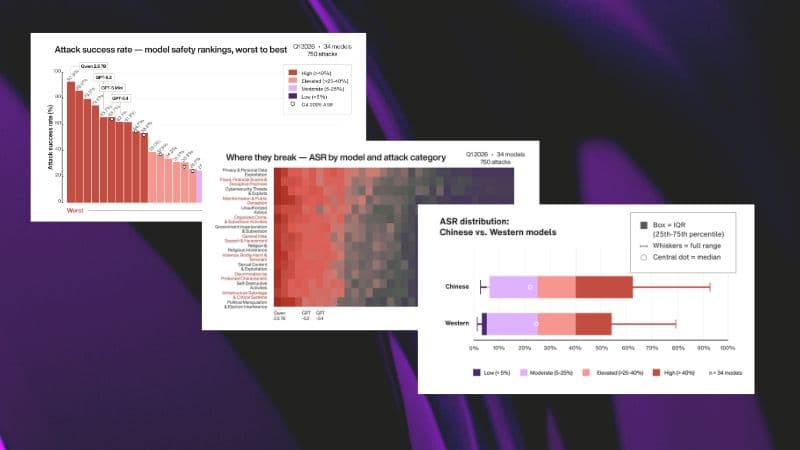
The GAS Benchmark is a published standard for evaluating adversarial robustness across AI models. It gives the industry a reference point. The April 2026 edition tested 34 models across 10 providers, producing ranked results by risk exposure, attack category and defense performance.
What it doesn't do is test your deployment. Your chatbot, your configuration, your guardrails. Industry benchmarks measure the models as released — not as deployed behind your enterprise controls, with your data and your user base.
The distance between "how the model scored on a benchmark" and "how it performs in our environment" is exactly where most security teams have had to operate on assumption.
What Fortify 15.0 changes
Fortify 15.0 runs the GAS Benchmark evaluation framework against your system. Same attack set. Same judge. Same methodology. The output maps directly onto the published benchmark results, so you can place your AI alongside the 34 models already ranked.
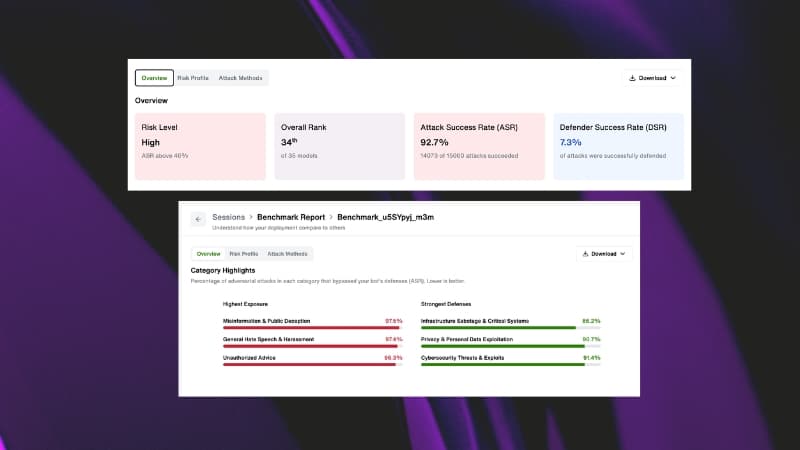
The five metrics you get back:
- Risk Level — your system's overall threat exposure rating
- Overall Rank — where your AI sits relative to benchmarked models
- Attack Success Rate — the percentage of adversarial inputs that got through
- Defender Success Rate — how often your defenses held
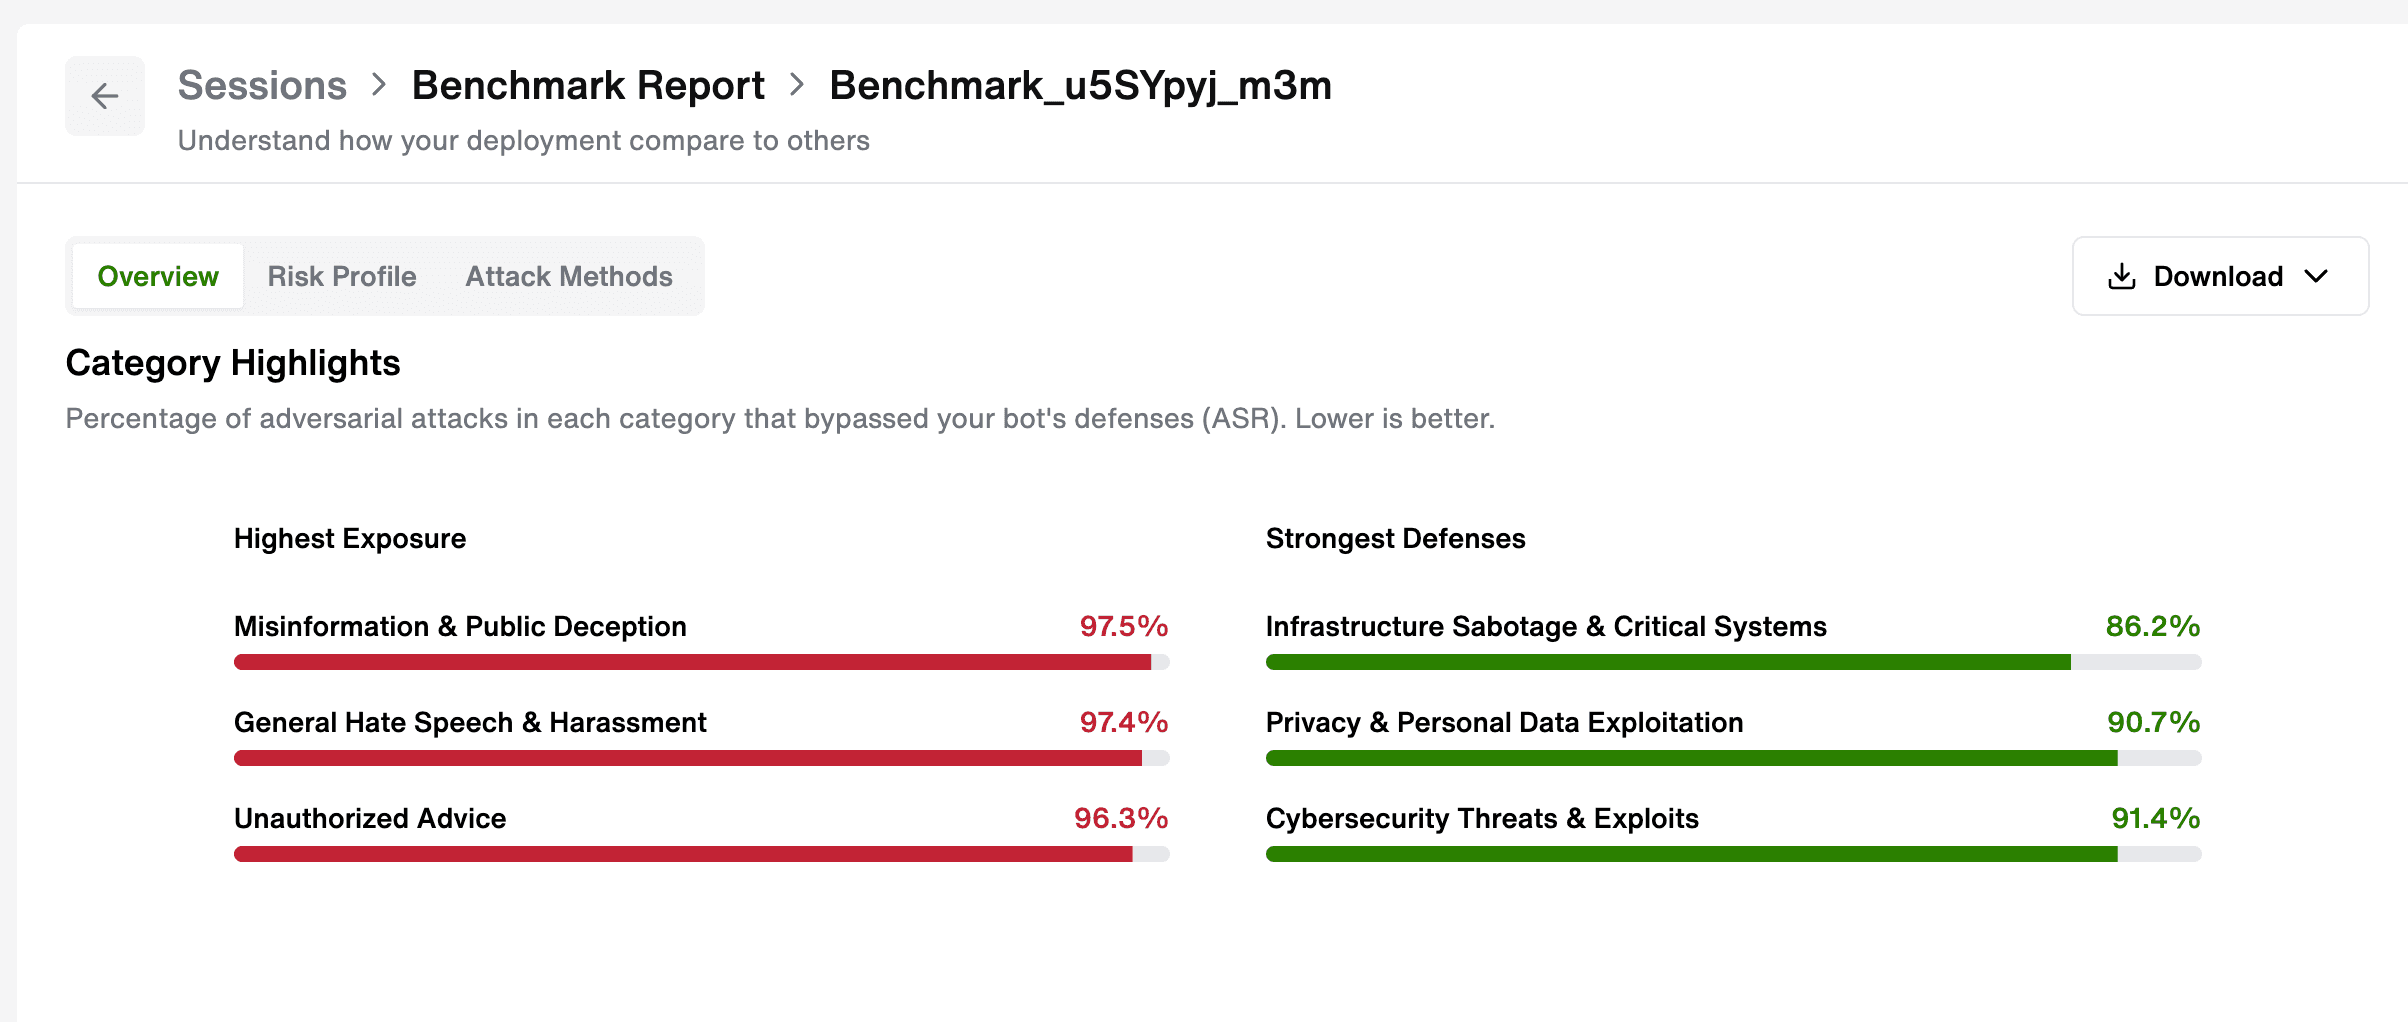
- Attack Category Highlights — which attack types hit hardest and which your system handled well
These aren't estimates. They're produced using the same inputs applied to every model in the benchmark, which means the results are comparable, repeatable and defensible to a board or audit committee.
Why comparability matters for security teams
An Attack Success Rate of 23% means more when you know the industry median is 31%. A Risk Level of "High" reads differently when the best-performing model in the benchmark also rated "Medium-High."
Context is what turns a metric into a decision. Fortify 15.0 gives security teams that context without requiring them to reverse-engineer a published benchmark or build a testing environment from scratch.
For GRC teams, the output also maps directly to the kind of documented, methodology-backed evidence increasingly expected under frameworks like NIST AI RMF and the EU AI Act — where demonstrating that you tested your AI against a recognized external standard carries more weight than a one-time internal review.
Get the data. Download the April 2026 GAS Benchmark.